import matplotlib.pyplot as plt
import numpy as np
import seaborn as sns
# because the default is the line style '-',
# nothing will be shown if we only pass in one point (3,2)
plt.plot(3, 2)
[<matplotlib.lines.Line2D at 0x226149a1ac0>]
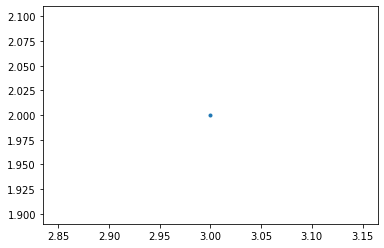
# we can pass in '.' to plt.plot to indicate that we want
# the point (3,2) to be indicated with a marker '.'
plt.plot(3, 2, '.')
[<matplotlib.lines.Line2D at 0x22614a18730>]
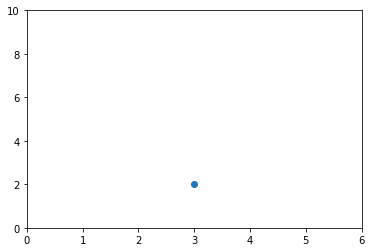
# create a new figure
plt.figure()

# plot the point (3,2) using the circle marker
plt.plot(3, 2, 'o')

# get the current axes
ax = plt.gca()

# Set axis properties [xmin, xmax, ymin, ymax]
ax.axis([0,6,0,10])
(0.0, 6.0, 0.0, 10.0)
Scatterplots
import numpy as np

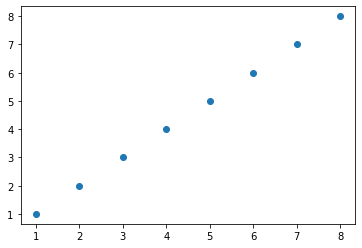
x = np.array([1,2,3,4,5,6,7,8])
y = x

plt.figure()
plt.scatter(x, y) # similar to plt.plot(x, y, '.'), but the underlying child objects in th
<matplotlib.collections.PathCollection at 0x22614ae8cd0>
import numpy as np

x = np.array([1,2,3,4,5,6,7,8])
y = x

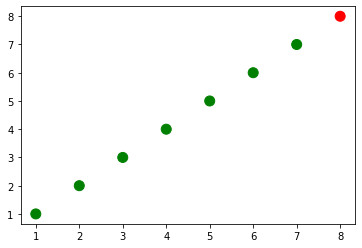
# create a list of colors for each point to have
# ['green', 'green', 'green', 'green', 'green', 'green', 'green', 'red']
colors = ['green']*(len(x)-1)
colors.append('red')

plt.figure()

# plot the point with size 100 and chosen colors
plt.scatter(x, y, s=100, c=colors)
<matplotlib.collections.PathCollection at 0x22614b5e9a0>
zip_generator = zip([1,2,3,4,5], [6,7,8,9,10])
# let's turn the data back into 2 lists
x, y = zip(*zip_generator) # This is like calling zip((1, 6), (2, 7), (3, 8), (4, 9), (5, 10))
print(x)
print(y)

# plot a data series in red using the first two elements of x and y
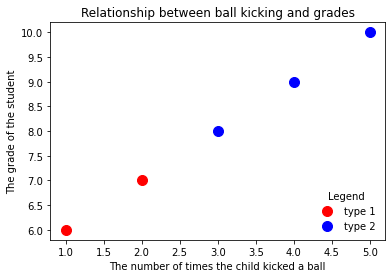
plt.scatter(x[:2], y[:2], s=100, c='red', label='type 1')
# plot a second data series in blue using the last three elements of x and y
plt.scatter(x[2:], y[2:], s=100, c='blue', label='type 2')


# add a label to the x axis
plt.xlabel('The number of times the child kicked a ball')
# add a label to the y axis
plt.ylabel('The grade of the student')
# add a title
plt.title('Relationship between ball kicking and grades')

# add the legend to loc=4 (the lower right hand corner), also gets rid of the frame and adds a title
plt.legend(loc=4, frameon=False, title='Legend')
(1, 2, 3, 4, 5)
(6, 7, 8, 9, 10)


<matplotlib.legend.Legend at 0x22615b71f10>
Line plots
import numpy as np

linear_data = np.array([1,2,3,4,5,6,7,8])
exponential_data = linear_data**2

plt.figure()
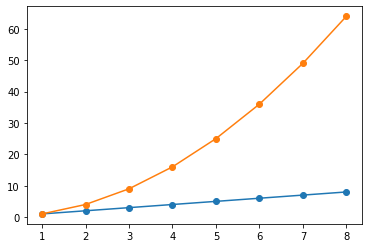
# plot the linear data and the exponential data
plt.plot(list(range(1,9)), linear_data, '-o', list(range(1,9)), exponential_data, '-o')
[<matplotlib.lines.Line2D at 0x22615c05fa0>,
 <matplotlib.lines.Line2D at 0x22615c130a0>]
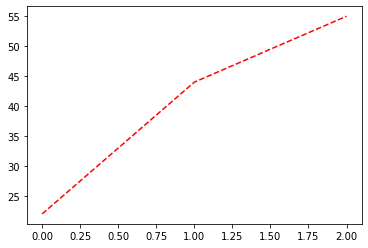
# plot another series with a dashed red line
plt.plot([22,44,55], '--r')
[<matplotlib.lines.Line2D at 0x22615c77400>]
plt.figure()
plt.plot(list(range(1,9)), linear_data, '-o', list(range(1,9)), exponential_data, '-o')

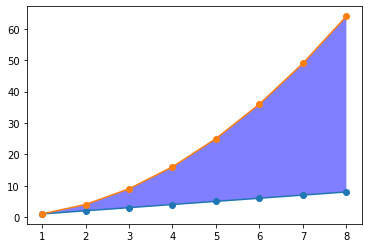
# fill the area between the linear data and exponential data
plt.gca().fill_between(range(1, len(linear_data) + 1),
                       linear_data, exponential_data,
                       facecolor='blue',
                       alpha=0.5)
<matplotlib.collections.PolyCollection at 0x22615cebb50>
import pandas as pd

plt.figure()
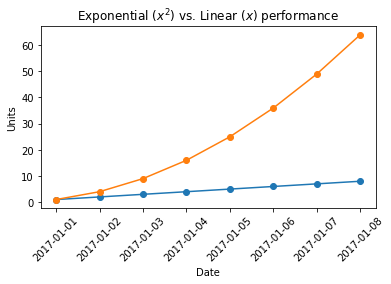
observation_dates = np.arange('2017-01-01', '2017-01-09', dtype='datetime64[D]')
observation_dates = list(map(pd.to_datetime, observation_dates)) # trying to plot a map will result in an error
plt.plot(observation_dates, linear_data, '-o',  observation_dates, exponential_data, '-o')

x = plt.gca().xaxis

# rotate the tick labels for the x axis
for item in x.get_ticklabels():
    item.set_rotation(45)

# adjust the subplot so the text doesn't run off the image
plt.subplots_adjust(bottom=0.25)

ax = plt.gca()
ax.set_xlabel('Date')
ax.set_ylabel('Units')
ax.set_title("Exponential ($x^2$) vs. Linear ($x$) performance")
Text(0.5, 1.0, 'Exponential ($x^2$) vs. Linear ($x$) performance')
Bar Charts
plt.figure()
xvals = range(len(linear_data))
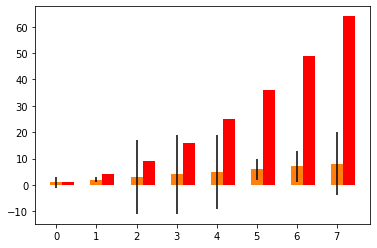
plt.bar(xvals, linear_data, width = 0.3)

new_xvals = []

# plot another set of bars, adjusting the new xvals to make up for the first set of bars plotted
for item in xvals:
    new_xvals.append(item+0.3)

plt.bar(new_xvals, exponential_data, width = 0.3 ,color='red')

from random import randint
linear_err = [randint(0,15) for x in range(len(linear_data))]

# This will plot a new set of bars with errorbars using the list of random error values
plt.bar(xvals, linear_data, width = 0.3, yerr=linear_err)
<BarContainer object of 8 artists>
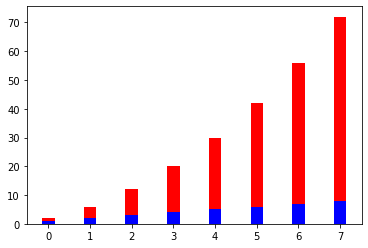
# stacked bar charts are also possible
plt.figure()
xvals = range(len(linear_data))
plt.bar(xvals, linear_data, width = 0.3, color='b')
plt.bar(xvals, exponential_data, width = 0.3, bottom=linear_data, color='r')
<BarContainer object of 8 artists>
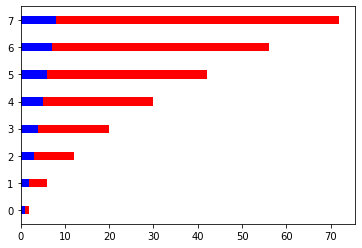
# or use barh for horizontal bar charts
plt.figure()
xvals = range(len(linear_data))
plt.barh(xvals, linear_data, height = 0.3, color='b')
plt.barh(xvals, exponential_data, height = 0.3, left=linear_data, color='r')
<BarContainer object of 8 artists>
Subplots
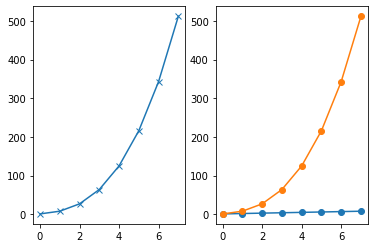
plt.figure()
# subplot with 1 row, 2 columns, and current axis is 1st subplot axes
plt.subplot(1, 2, 2)

linear_data = np.array([1,2,3,4,5,6,7,8])

plt.plot(linear_data, '-o')

exponential_data = linear_data**3

# subplot with 1 row, 2 columns, and current axis is 2nd subplot axes
plt.subplot(1, 2, 2)
plt.plot(exponential_data, '-o')

# plot exponential data on 1st subplot axes
plt.subplot(1, 2, 1)
plt.plot(exponential_data, '-x')
[<matplotlib.lines.Line2D at 0x22615fdbeb0>]
plt.figure()
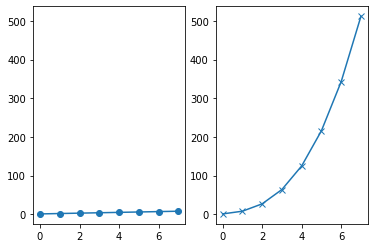
ax1 = plt.subplot(1, 2, 1)
plt.plot(linear_data, '-o')
# pass sharey=ax1 to ensure the two subplots share the same y axis
ax2 = plt.subplot(1, 2, 2, sharey=ax1)
plt.plot(exponential_data, '-x')
[<matplotlib.lines.Line2D at 0x22616092c10>]
plt.figure()
# the right hand side is equivalent shorthand syntax
plt.subplot(1,2,1) == plt.subplot(121)
True
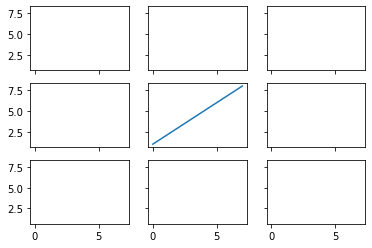
# create a 3x3 grid of subplots
fig, ax = plt.subplots(3, 3, sharex=True, sharey=True)
# plot the linear_data on the 5th subplot axes
ax[1][1].plot(linear_data, '-')
[<matplotlib.lines.Line2D at 0x22616337430>]
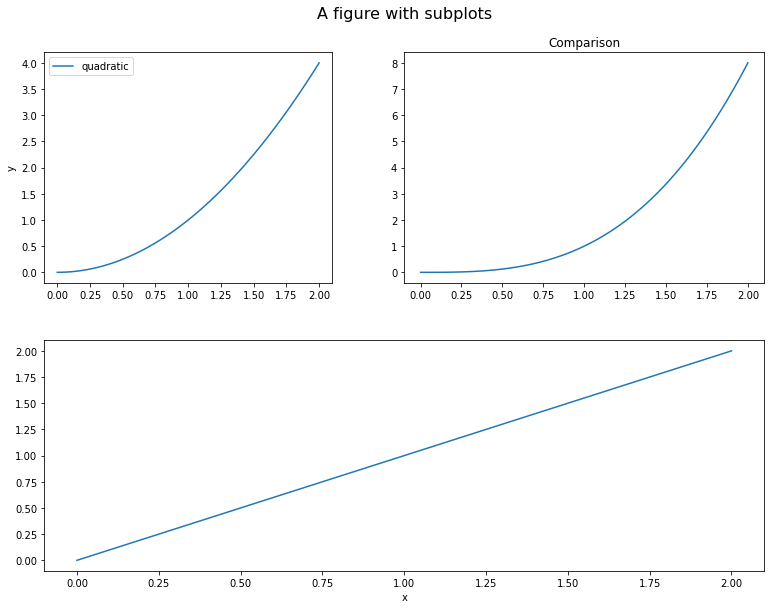
x = np.linspace(0, 2, 100)

fig = plt.figure(figsize=(10, 8))
fig.suptitle('A figure with subplots', fontsize=16)

ax_1 = fig.add_axes([0, 0, 1, 0.4])
ax_2 = fig.add_axes([0, 0.5, 0.4, 0.4])
ax_3 = fig.add_axes([0.5, 0.5, 0.5, 0.4])

ax_1.plot(x, x, label='linear')
ax_2.plot(x, x**2, label='quadratic')
ax_3.plot(x, x**3, label='cubic')

ax_1.set_xlabel('x')
ax_2.set_ylabel('y')
ax_3.set_title('Comparison')

ax_2.legend(loc='best')
<matplotlib.legend.Legend at 0x22616417100>
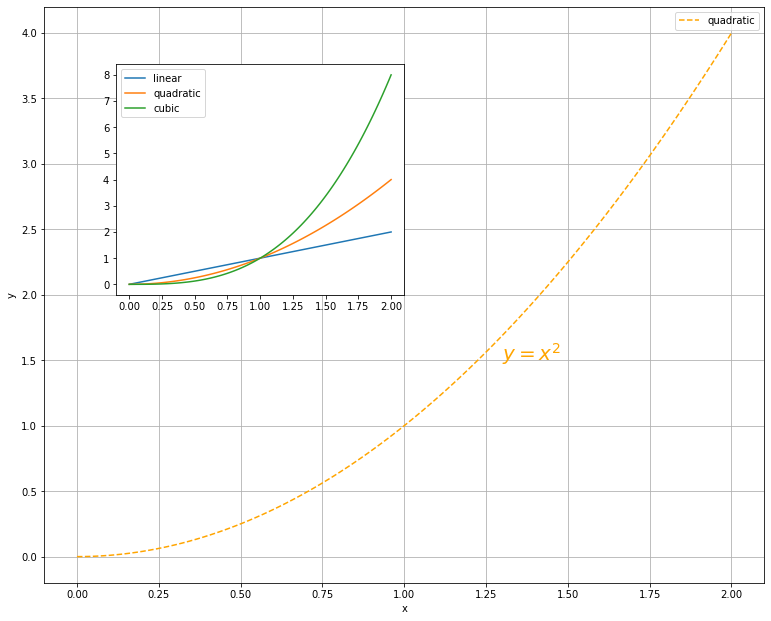
x = np.linspace(0, 2, 100)

fig = plt.figure(figsize=(10, 8))

ax_1 = fig.add_axes([0, 0, 1, 1])
ax_2 = fig.add_axes([0.1, 0.5, 0.4, 0.4])

ax_1.plot(x, x**2, label='quadratic', color='orange', linestyle='dashed')
ax_1.text(1.3, 1.5, r"$y=x^2$", fontsize=20, color="orange")
ax_1.grid(True)

ax_2.plot(x, x, label='linear')
ax_2.plot(x, x**2, label='quadratic')
ax_2.plot(x, x**3, label='cubic')

ax_1.set_xlabel('x')
ax_1.set_ylabel('y')

ax_1.legend(loc='best')
ax_2.legend(loc='best')
<matplotlib.legend.Legend at 0x2261493e280>
Histograms
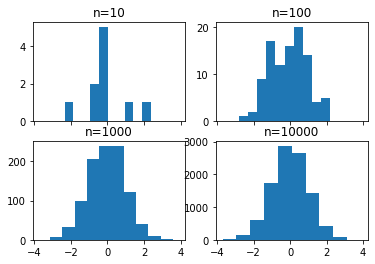
# create 2x2 grid of axis subplots
fig, ((ax1, ax2), (ax3, ax4)) = plt.subplots(2, 2, sharex=True)
axs = [ax1,ax2,ax3,ax4]

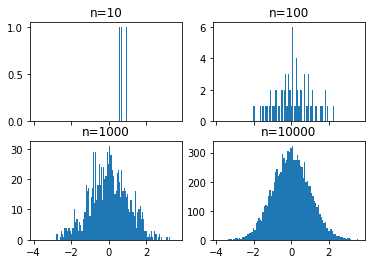
# draw n = 10, 100, 1000, and 10000 samples from the normal distribution and plot corresponding histograms
for n in range(0,len(axs)):
    sample_size = 10**(n+1)
    sample = np.random.normal(loc=0.0, scale=1.0, size=sample_size)
    axs[n].hist(sample)
    axs[n].set_title('n={}'.format(sample_size))
# repeat with number of bins set to 100
fig, ((ax1, ax2), (ax3, ax4)) = plt.subplots(2, 2, sharex=True)
axs = [ax1,ax2,ax3,ax4]

for n in range(0,len(axs)):
    sample_size = 10**(n+1)
    sample = np.random.normal(loc=0.0, scale=1.0, size=sample_size)
    axs[n].hist(sample, bins=100)
    axs[n].set_title('n={}'.format(sample_size))
plt.figure()
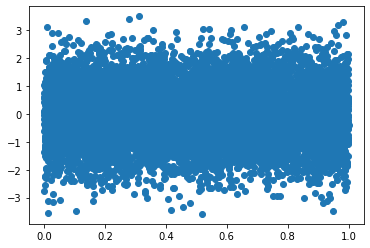
Y = np.random.normal(loc=0.0, scale=1.0, size=10000)
X = np.random.random(size=10000)
plt.scatter(X,Y)
<matplotlib.collections.PathCollection at 0x226171d6f10>
# use gridspec to partition the figure into subplots
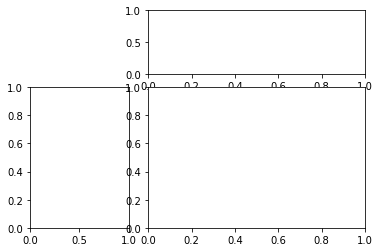
import matplotlib.gridspec as gridspec

plt.figure()
gspec = gridspec.GridSpec(3, 3)

top_histogram = plt.subplot(gspec[0, 1:])
side_histogram = plt.subplot(gspec[1:, 0])
lower_right = plt.subplot(gspec[1:, 1:])
plt.figure()
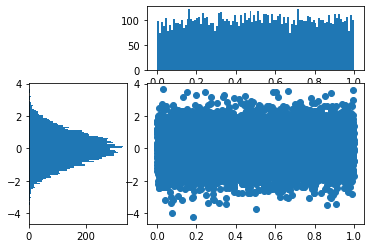
gspec = gridspec.GridSpec(3, 3)

top_histogram = plt.subplot(gspec[0, 1:])
side_histogram = plt.subplot(gspec[1:, 0])
lower_right = plt.subplot(gspec[1:, 1:])

Y = np.random.normal(loc=0.0, scale=1.0, size=10000)
X = np.random.random(size=10000)
lower_right.scatter(X, Y)
top_histogram.hist(X, bins=100)
s = side_histogram.hist(Y, bins=100, orientation='horizontal')
Heatmaps
plt.figure()

Y = np.random.normal(loc=0.0, scale=1.0, size=10000)
X = np.random.random(size=10000)
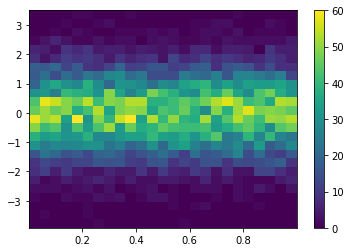
_ = plt.hist2d(X, Y, bins=25)
plt.colorbar()
<matplotlib.colorbar.Colorbar at 0x22616902d30>
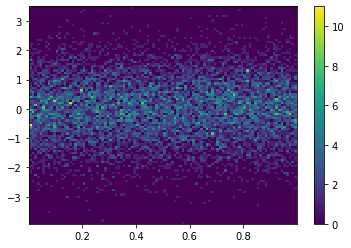
plt.hist2d(X, Y, bins=100)
plt.colorbar()
plt.show()
Pandas Visualization
plt.style.use('seaborn-colorblind')
np.random.seed(123)

df = pd.DataFrame({'A': np.random.randn(365).cumsum(0),
                   'B': np.random.randn(365).cumsum(0) + 20,
                   'C': np.random.randn(365).cumsum(0) - 20},
                  index=pd.date_range('1/1/2017', periods=365))
df.head()
| A | B | C | |
|---|---|---|---|
| 2017-01-01 | -1.085631 | 20.059291 | -20.230904 |
| 2017-01-02 | -0.088285 | 21.803332 | -16.659325 |
| 2017-01-03 | 0.194693 | 20.835588 | -17.055481 |
| 2017-01-04 | -1.311601 | 21.255156 | -17.093802 |
| 2017-01-05 | -1.890202 | 21.462083 | -19.518638 |
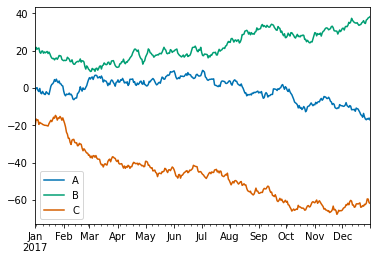
df.plot(); # add a semi-colon to the end of the plotting call to suppress unwanted output
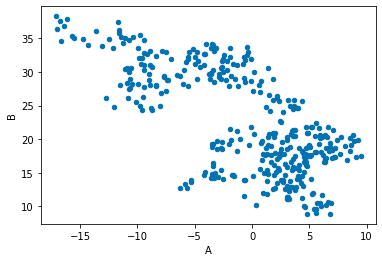
df.plot('A','B', kind = 'scatter');
You can also choose the plot kind by using the DataFrame.plot.kind methods instead of providing the kind keyword argument.
kind :
'line': line plot (default)'bar': vertical bar plot'barh': horizontal bar plot'hist': histogram'box': boxplot'kde': Kernel Density Estimation plot'density': same as ‘kde’'area': area plot'pie': pie plot'scatter': scatter plot'hexbin': hexbin plot
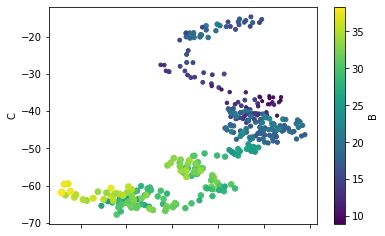
df.plot.scatter('A', 'C', c='B', s=df['B'], colormap='viridis')
<AxesSubplot:xlabel='A', ylabel='C'>
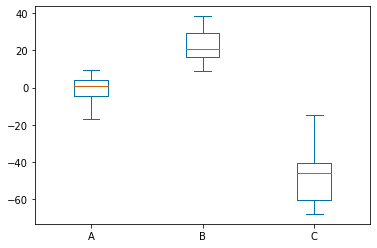
df.plot.box();
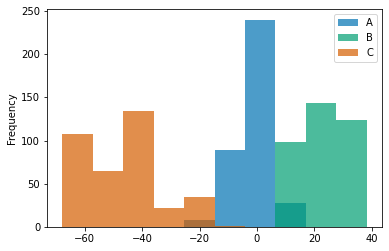
df.plot.hist(alpha=0.7);
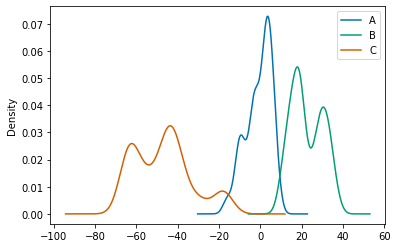
Kernel density estimation plots are useful for deriving a smooth continuous function from a given sample.
df.plot.kde()
<AxesSubplot:ylabel='Density'>
Seaborn
import seaborn as sns
np.random.seed(1234)

v1 = pd.Series(np.random.normal(0,10,1000), name='v1')
v2 = pd.Series(2*v1 + np.random.normal(60,15,1000), name='v2')
# plot a kernel density estimation over a stacked barchart
plt.figure()
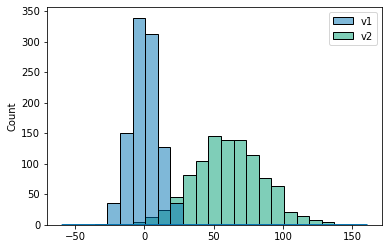
sns.histplot([v1, v2]);
v3 = np.concatenate((v1,v2))
sns.kdeplot(v3);

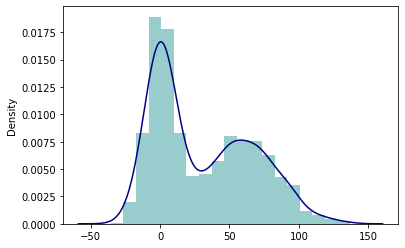
#! ???? why kde does not showing
sns.distplot(v3, hist_kws={'color': 'Teal'}, kde_kws={'color': 'Navy'});
c:\Users\LENOVO\AppData\Local\Programs\Python\Python39\lib\site-packages\seaborn\distributions.py:2619: FutureWarning: `distplot` is a deprecated function and will be removed in a future version. Please adapt your code to use either `displot` (a figure-level function with similar flexibility) or `histplot` (an axes-level function for histograms).
  warnings.warn(msg, FutureWarning)
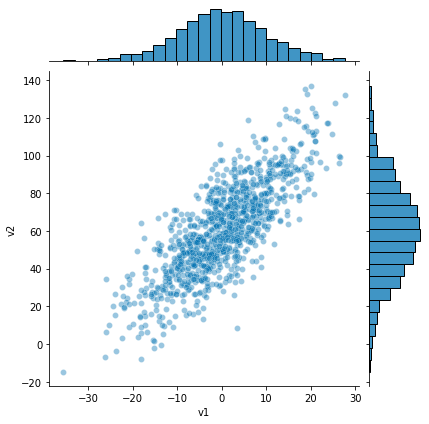
sns.jointplot(v1, v2, alpha=0.4);
c:\Users\LENOVO\AppData\Local\Programs\Python\Python39\lib\site-packages\seaborn\_decorators.py:36: FutureWarning: Pass the following variables as keyword args: x, y. From version 0.12, the only valid positional argument will be `data`, and passing other arguments without an explicit keyword will result in an error or misinterpretation.
  warnings.warn(
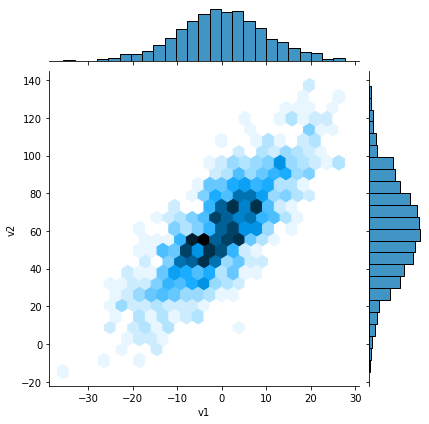
sns.jointplot(v1, v2, kind='hex');
c:\Users\LENOVO\AppData\Local\Programs\Python\Python39\lib\site-packages\seaborn\_decorators.py:36: FutureWarning: Pass the following variables as keyword args: x, y. From version 0.12, the only valid positional argument will be `data`, and passing other arguments without an explicit keyword will result in an error or misinterpretation.
  warnings.warn(
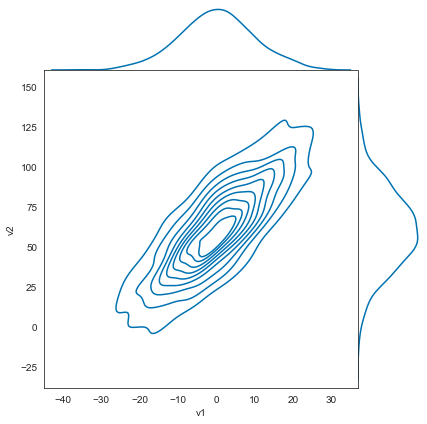
sns.set_style('white')

sns.jointplot(v1, v2, kind='kde', space=0);
c:\Users\LENOVO\AppData\Local\Programs\Python\Python39\lib\site-packages\seaborn\_decorators.py:36: FutureWarning: Pass the following variables as keyword args: x, y. From version 0.12, the only valid positional argument will be `data`, and passing other arguments without an explicit keyword will result in an error or misinterpretation.
  warnings.warn(
iris = pd.read_csv('iris.csv')
iris.head()
| sepal.length | sepal.width | petal.length | petal.width | variety | |
|---|---|---|---|---|---|
| 0 | 5.1 | 3.5 | 1.4 | 0.2 | Setosa |
| 1 | 4.9 | 3.0 | 1.4 | 0.2 | Setosa |
| 2 | 4.7 | 3.2 | 1.3 | 0.2 | Setosa |
| 3 | 4.6 | 3.1 | 1.5 | 0.2 | Setosa |
| 4 | 5.0 | 3.6 | 1.4 | 0.2 | Setosa |
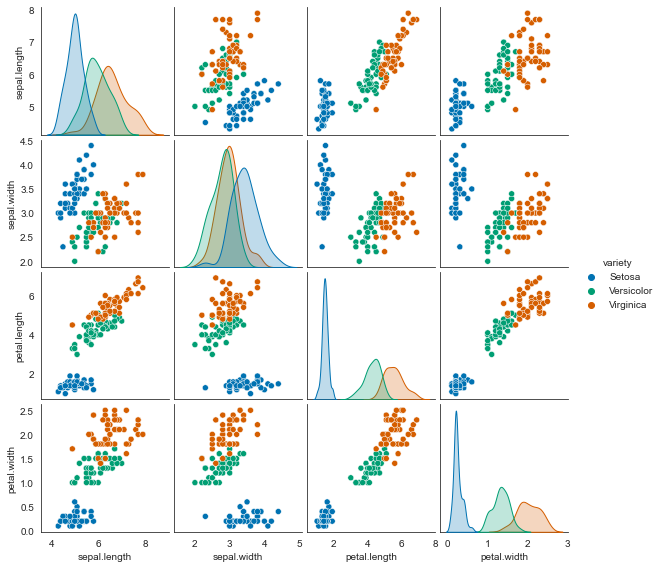
sns.pairplot(iris, hue='variety', diag_kind='kde', size=2);
c:\Users\LENOVO\AppData\Local\Programs\Python\Python39\lib\site-packages\seaborn\axisgrid.py:2076: UserWarning: The `size` parameter has been renamed to `height`; please update your code.
  warnings.warn(msg, UserWarning)
plt.figure(figsize=(8,6))
plt.subplot(121)
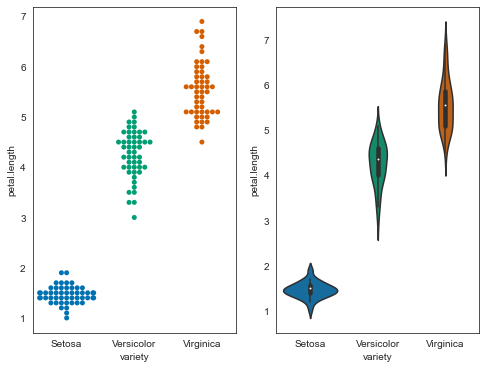
sns.swarmplot('variety', 'petal.length', data=iris);
plt.subplot(122)
sns.violinplot('variety', 'petal.length', data=iris);
c:\Users\LENOVO\AppData\Local\Programs\Python\Python39\lib\site-packages\seaborn\_decorators.py:36: FutureWarning: Pass the following variables as keyword args: x, y. From version 0.12, the only valid positional argument will be `data`, and passing other arguments without an explicit keyword will result in an error or misinterpretation.
  warnings.warn(
c:\Users\LENOVO\AppData\Local\Programs\Python\Python39\lib\site-packages\seaborn\categorical.py:1296: UserWarning: 8.0% of the points cannot be placed; you may want to decrease the size of the markers or use stripplot.
  warnings.warn(msg, UserWarning)
c:\Users\LENOVO\AppData\Local\Programs\Python\Python39\lib\site-packages\seaborn\_decorators.py:36: FutureWarning: Pass the following variables as keyword args: x, y. From version 0.12, the only valid positional argument will be `data`, and passing other arguments without an explicit keyword will result in an error or misinterpretation.
  warnings.warn(
tips = sns.load_dataset('tips')
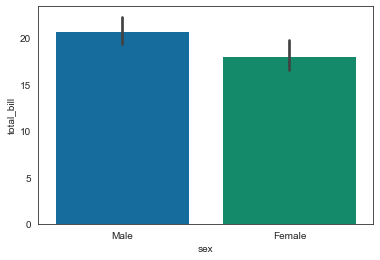
sns.barplot(x='sex', y='total_bill', data=tips)
<AxesSubplot:xlabel='sex', ylabel='total_bill'>
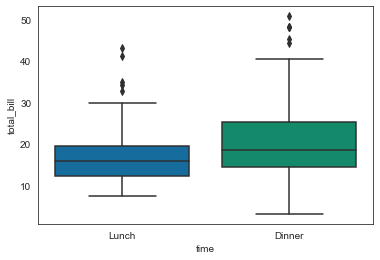
sns.boxplot(x='time', y='total_bill', data=tips)
<AxesSubplot:xlabel='time', ylabel='total_bill'>
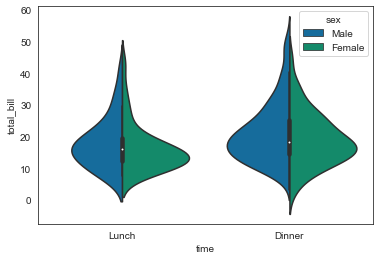
sns.violinplot(x='time', y='total_bill', data=tips, hue='sex', split=True)
<AxesSubplot:xlabel='time', ylabel='total_bill'>
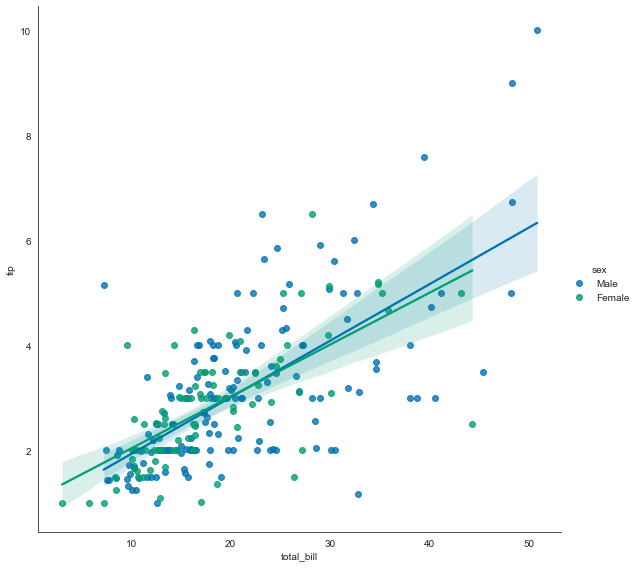
sns.lmplot(x='total_bill', y='tip', data=tips, hue='sex', height=8, aspect=1)
<seaborn.axisgrid.FacetGrid at 0x226167563d0>
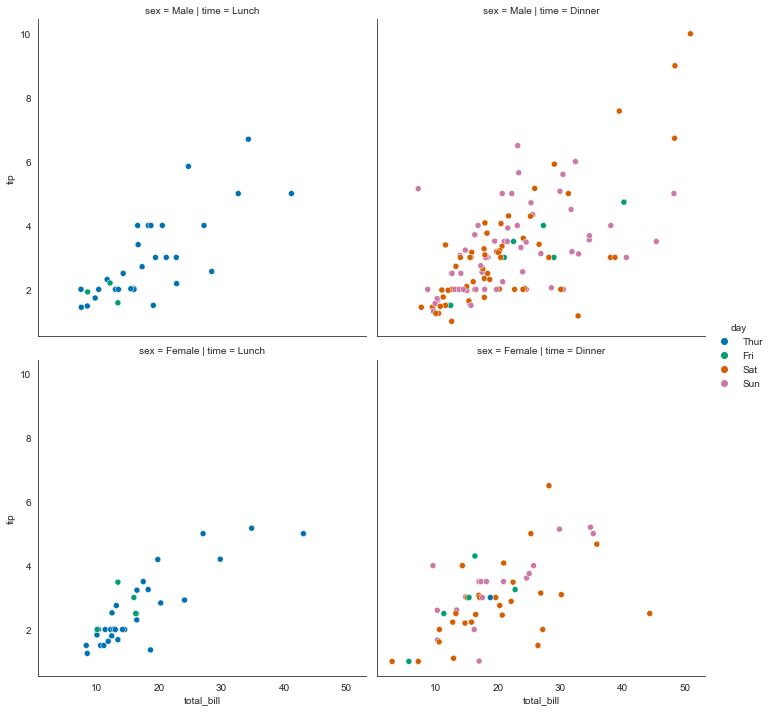
sns.relplot(data=tips, x="total_bill", y="tip", hue="day", col="time", row="sex")
<seaborn.axisgrid.FacetGrid at 0x2261c488370>
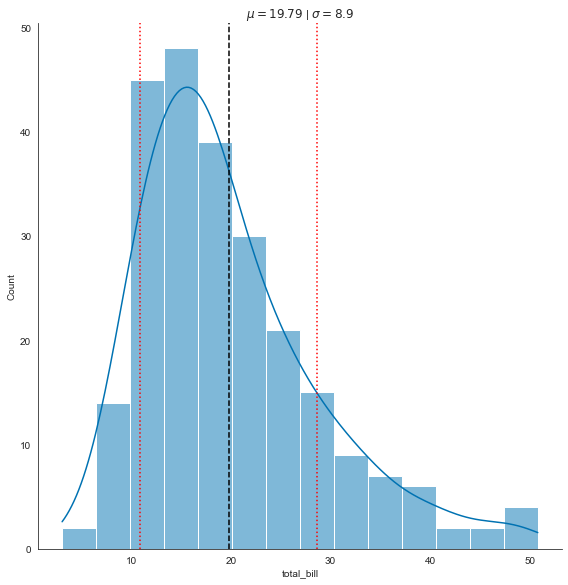
tips_mean = tips.total_bill.mean()
tips_sd = tips.total_bill.std()

ax = sns.displot(data=tips, x="total_bill", kde=True, height=8)

plt.axvline(x=tips_mean, color='black', linestyle='dashed')

plt.axvline(x=tips_mean + tips_sd, color='red', linestyle='dotted')
plt.axvline(x=tips_mean - tips_sd, color='red', linestyle='dotted')

plt.title('$\mu = {}$ | $\sigma = {}$'.format(round(tips_mean, 2), round(tips_sd, 2)))
Text(0.5, 1.0, '$\\mu = 19.79$ | $\\sigma = 8.9$')
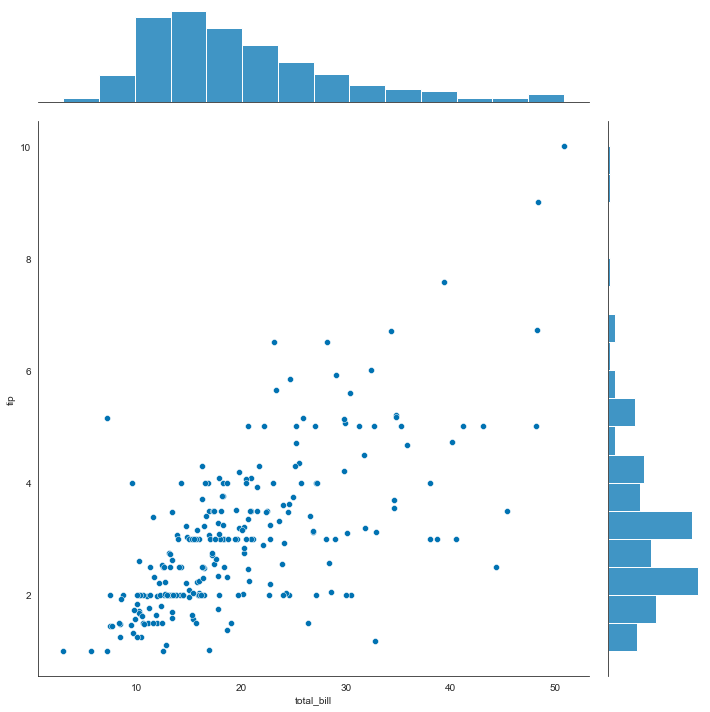
sns.jointplot(x=tips['total_bill'], y=tips['tip'], height=10)
<seaborn.axisgrid.JointGrid at 0x2261c61d6d0>
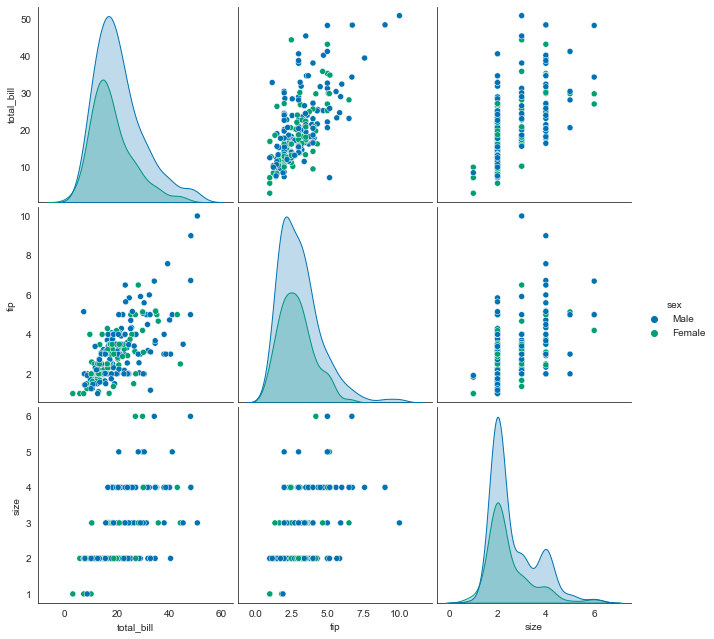
sns.pairplot(tips, hue='sex', height=3)
<seaborn.axisgrid.PairGrid at 0x2261c748bb0>
Bad Visualization
- inconsistent scale
x_1 = np.linspace(0, 1, 80, endpoint=False)
x_2 = np.linspace(1, 2, 20)
x = np.concatenate((x_1, x_2))
plt.figure(figsize=(10, 8), dpi=80)
plt.plot(x, label='linear')
plt.plot(x**2, label='quadratic')
plt.plot(x**3, label='cubic')
plt.xlabel('x label')
plt.xticks([0, 20, 40, 60, 80, 90, 100], [0, 0.25, 0.5, 0.75, 1, 1.5, 2])
plt.ylabel('y label')
plt.title("Simple Plot")
plt.grid(True)
plt.legend()
<matplotlib.legend.Legend at 0x2261aaf5d60>
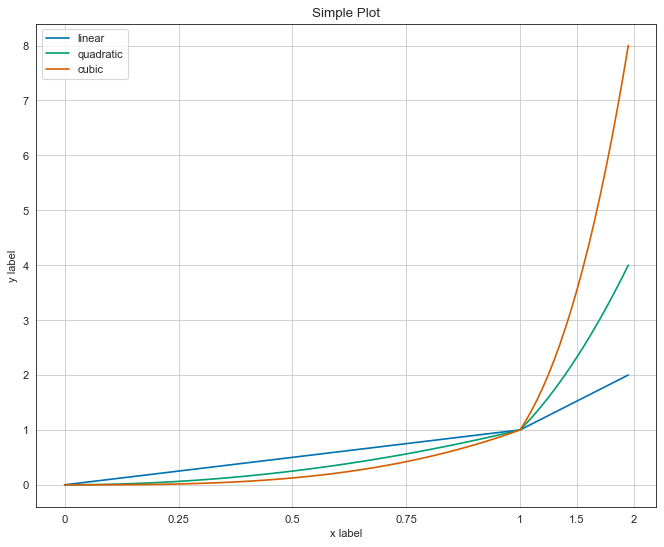
This is broken. in this plot the range from 1 to 2 on the x-axis is denser than the same range from 0 to 1. this easily leads you to misinterpretation.
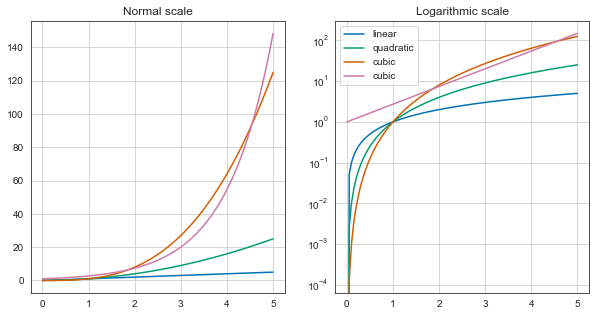
Don’t get it wrong, it is advised to use other scales rather than linear space when it’s beneficial. just be consistent and declare that the plot isn’t drawn on linear space.
x = np.linspace(0, 5, 100)
fig, axes = plt.subplots(1, 2, figsize=(10,5))

axes[0].plot(x, x, label='linear')
axes[0].plot(x, x**2, label='quadratic')
axes[0].plot(x, x**3, label='cubic')
axes[0].plot(x, np.exp(x), label='cubic')
axes[0].set_title("Normal scale")
axes[0].grid(True)

axes[1].plot(x, x, label='linear')
axes[1].plot(x, x**2, label='quadratic')
axes[1].plot(x, x**3, label='cubic')
axes[1].plot(x, np.exp(x), label='cubic')
axes[1].set_yscale("log")
axes[1].set_title("Logarithmic scale")
axes[1].grid(True)

axes[1].legend(loc='best')
<matplotlib.legend.Legend at 0x2261acd2040>
- Too many variables
diamonds = sns.load_dataset("diamonds")
fig = plt.figure(figsize=(10,8))
ax = diamonds.color.value_counts().plot(kind='pie')
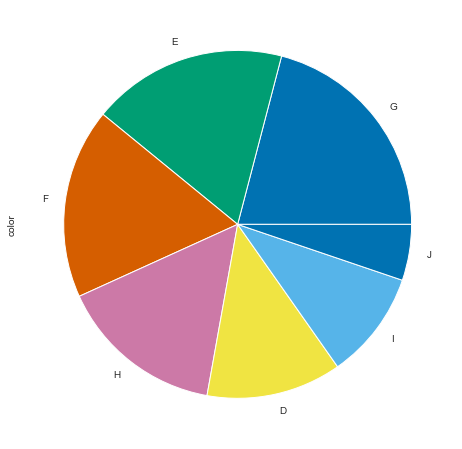
Too many variables, especially in the pie chart make it useless. use other categories or bar charts.
- Wrong type of chart
flights = sns.load_dataset("flights")
flights_1957 = flights[flights.year == 1957]
fig, axe = plt.subplots(1, figsize=(10,5))
axe.scatter(list(flights_1957.month), list(flights_1957.passengers), color='orange')
axe.plot(list(flights_1957.month), list(flights_1957.passengers), linestyle='dashed')
[<matplotlib.lines.Line2D at 0x2261be13d00>]
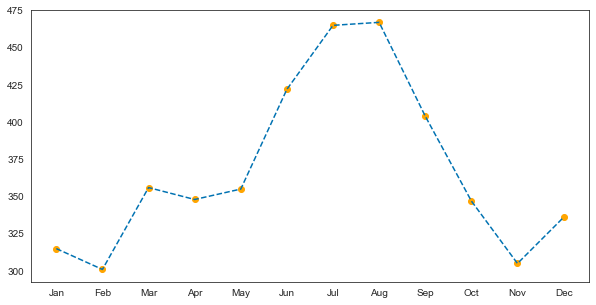
Data is not continuous. so we’re not allowed to draw a line between two consecutive months.
References
- datatoviz website
- Applied data science with python by Michigan university, Coursera
- Python for data analysis book by O’Reilly
- Pandas Bootcamp by Udemy
- https://sk7w4tch3r.github.io/CS-SBU-DataScience/